
Weekly Hiking Quiz using an e‑Paper Display
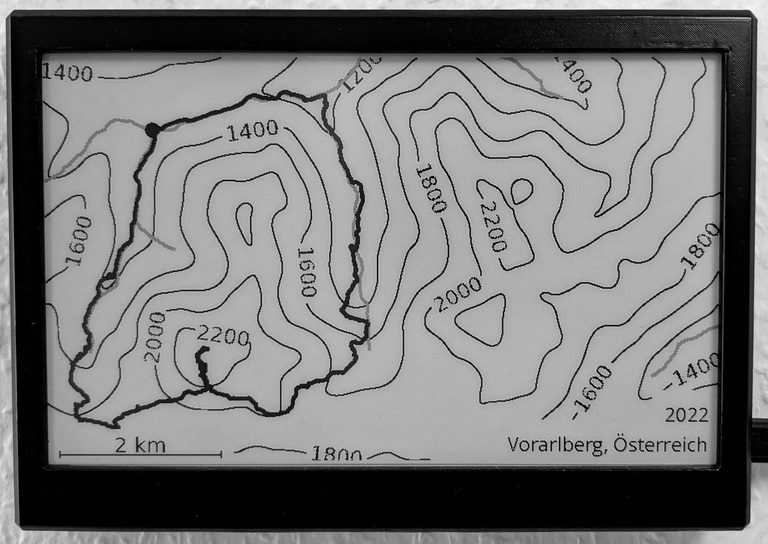
A few years ago, I started recording the GPS traces of all our hikes using an app. So far, I have not done much with the recordings other than storing them. After having collected recordings of around 70 hikes, I got the idea of using them for a weekly quiz. The main idea is that a new hike is randomly selected every week, and the quiz is about recognizing the hike and remembering it. To make it more challenging (and fun), only very little information about the hike is displayed on Mondays, and more and more information is added throughout the week. The information is displayed on an e-Paper display that is mounted in our living room.
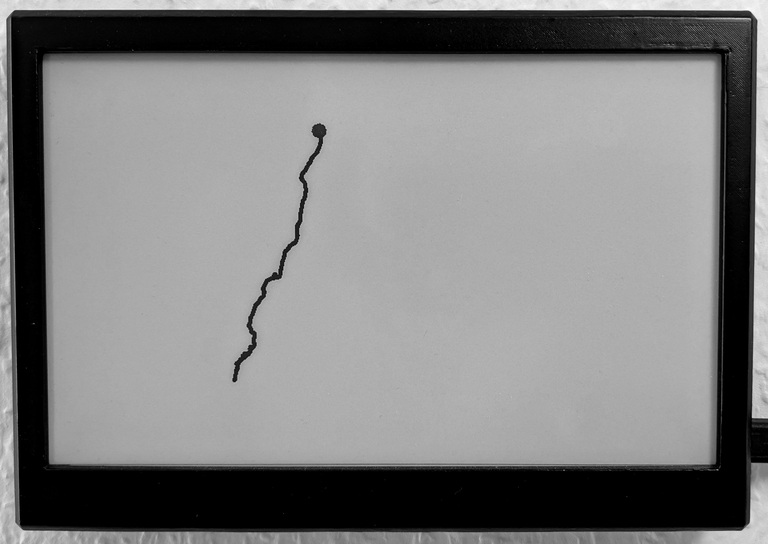
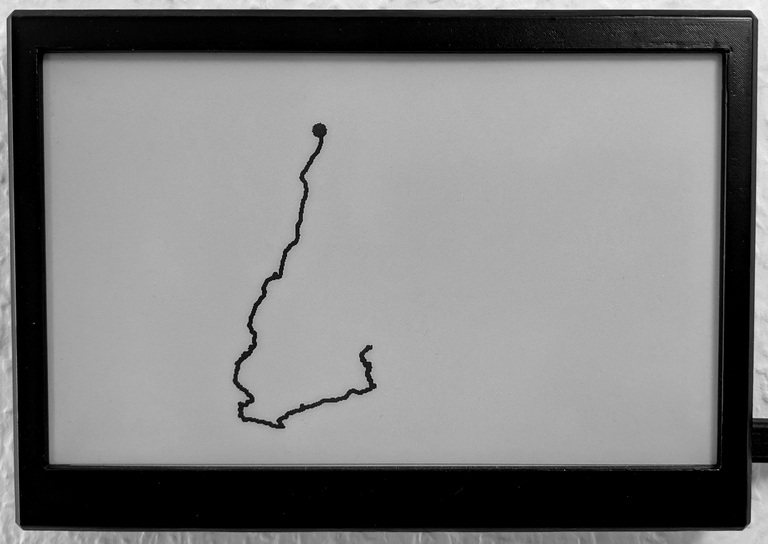
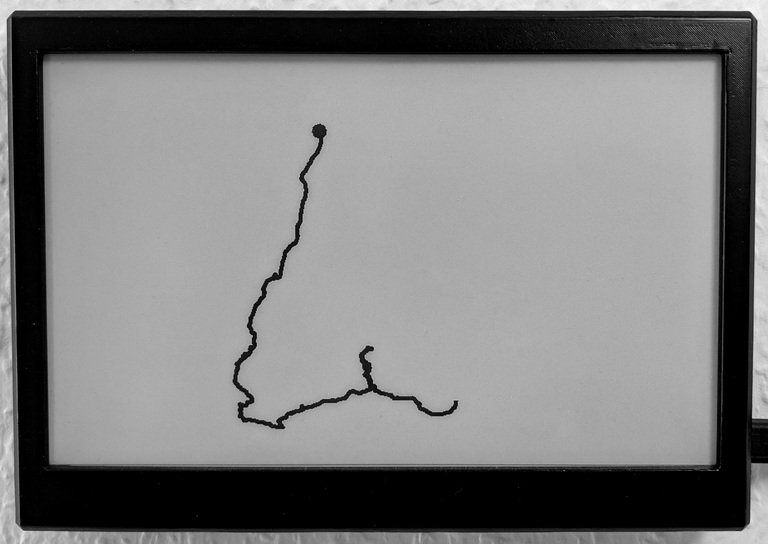
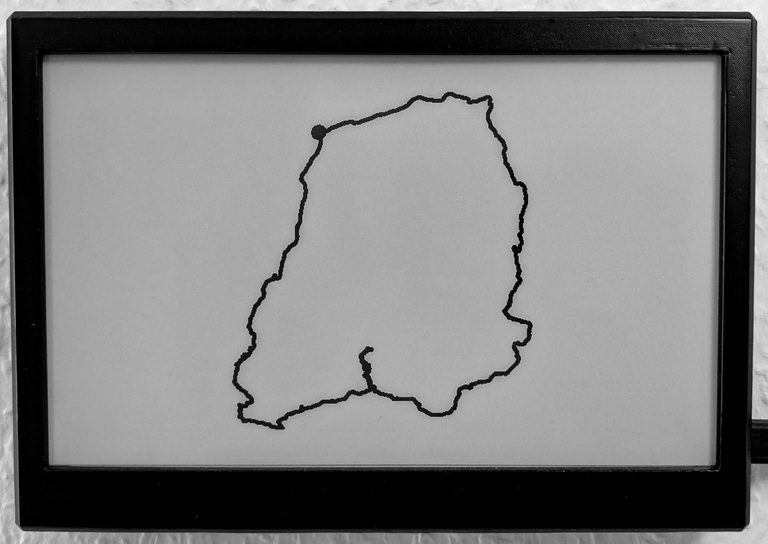
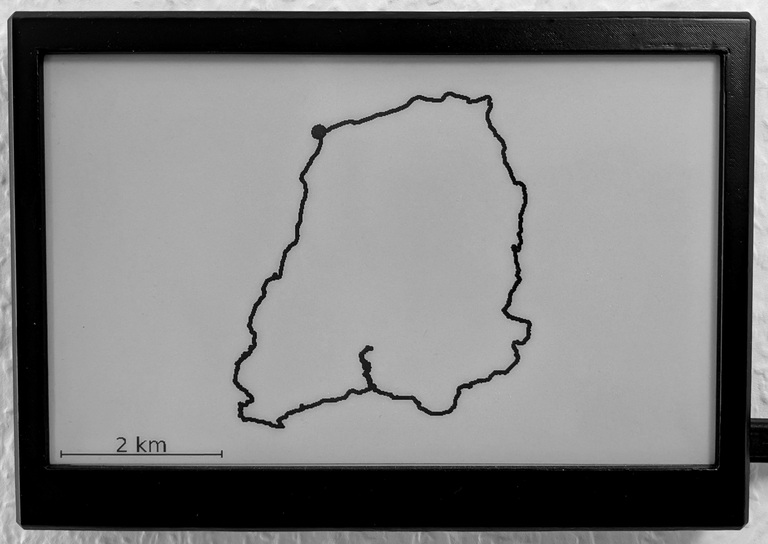
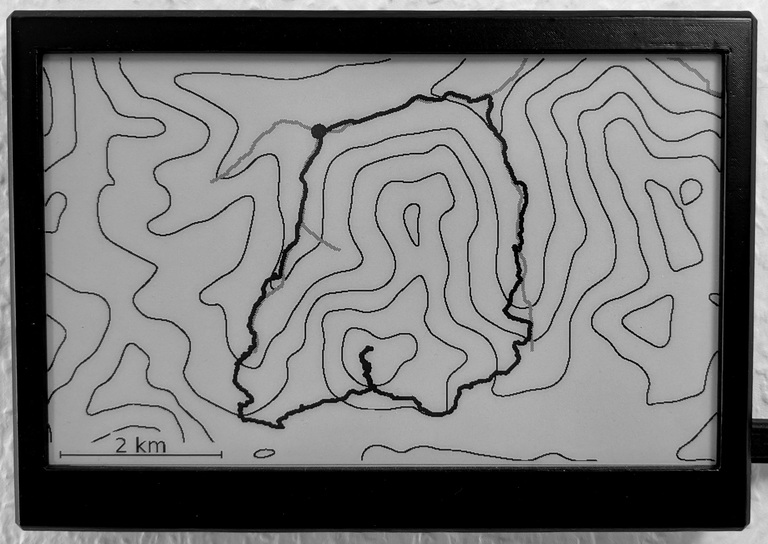
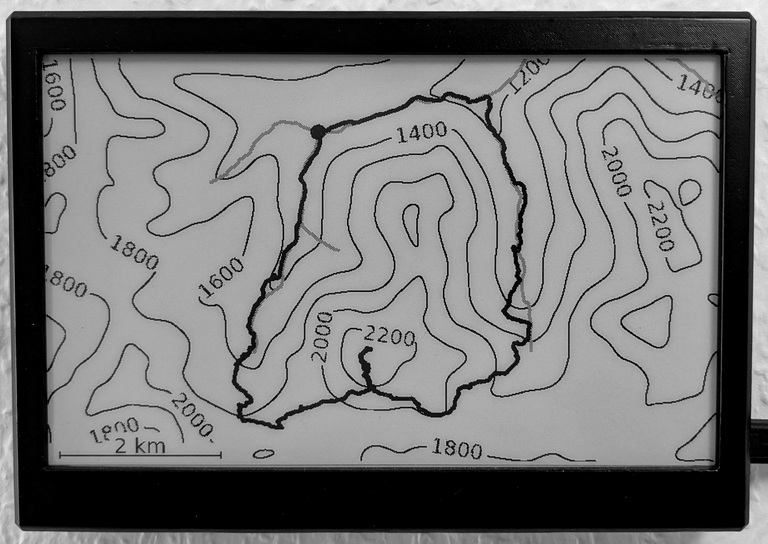
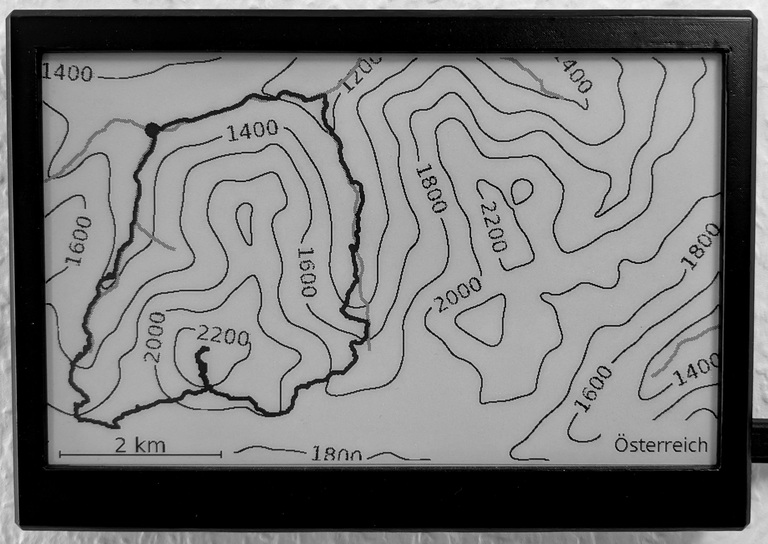
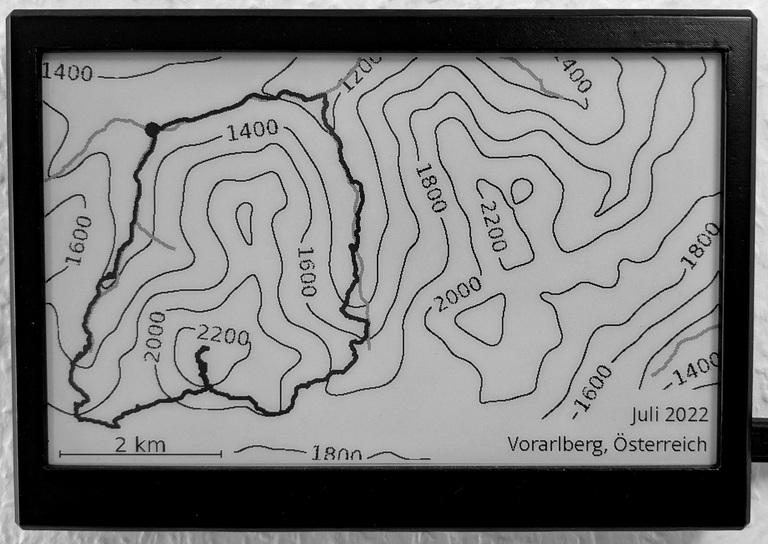
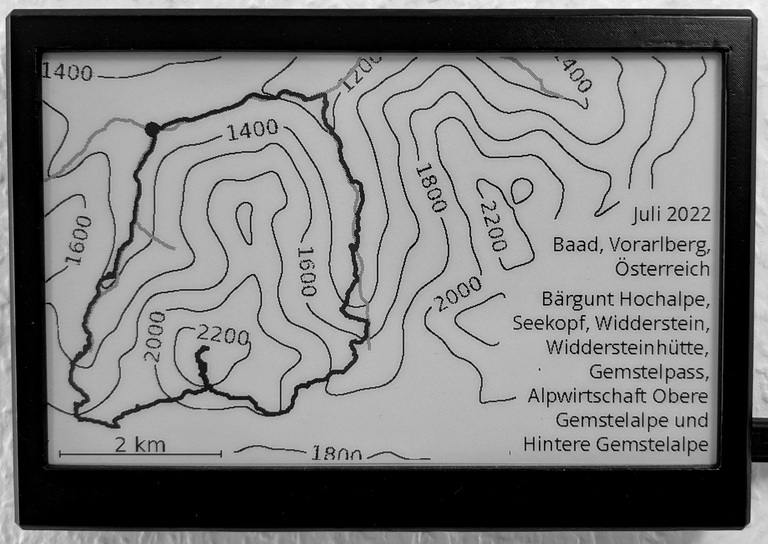
Here is an example to illustrate the quiz throughout a week (captions are only displayed on larger screens):


In the remainder of this article, I will describe in more detail how this was built.
Software
The following image illustrates the overall architecture and information flow:
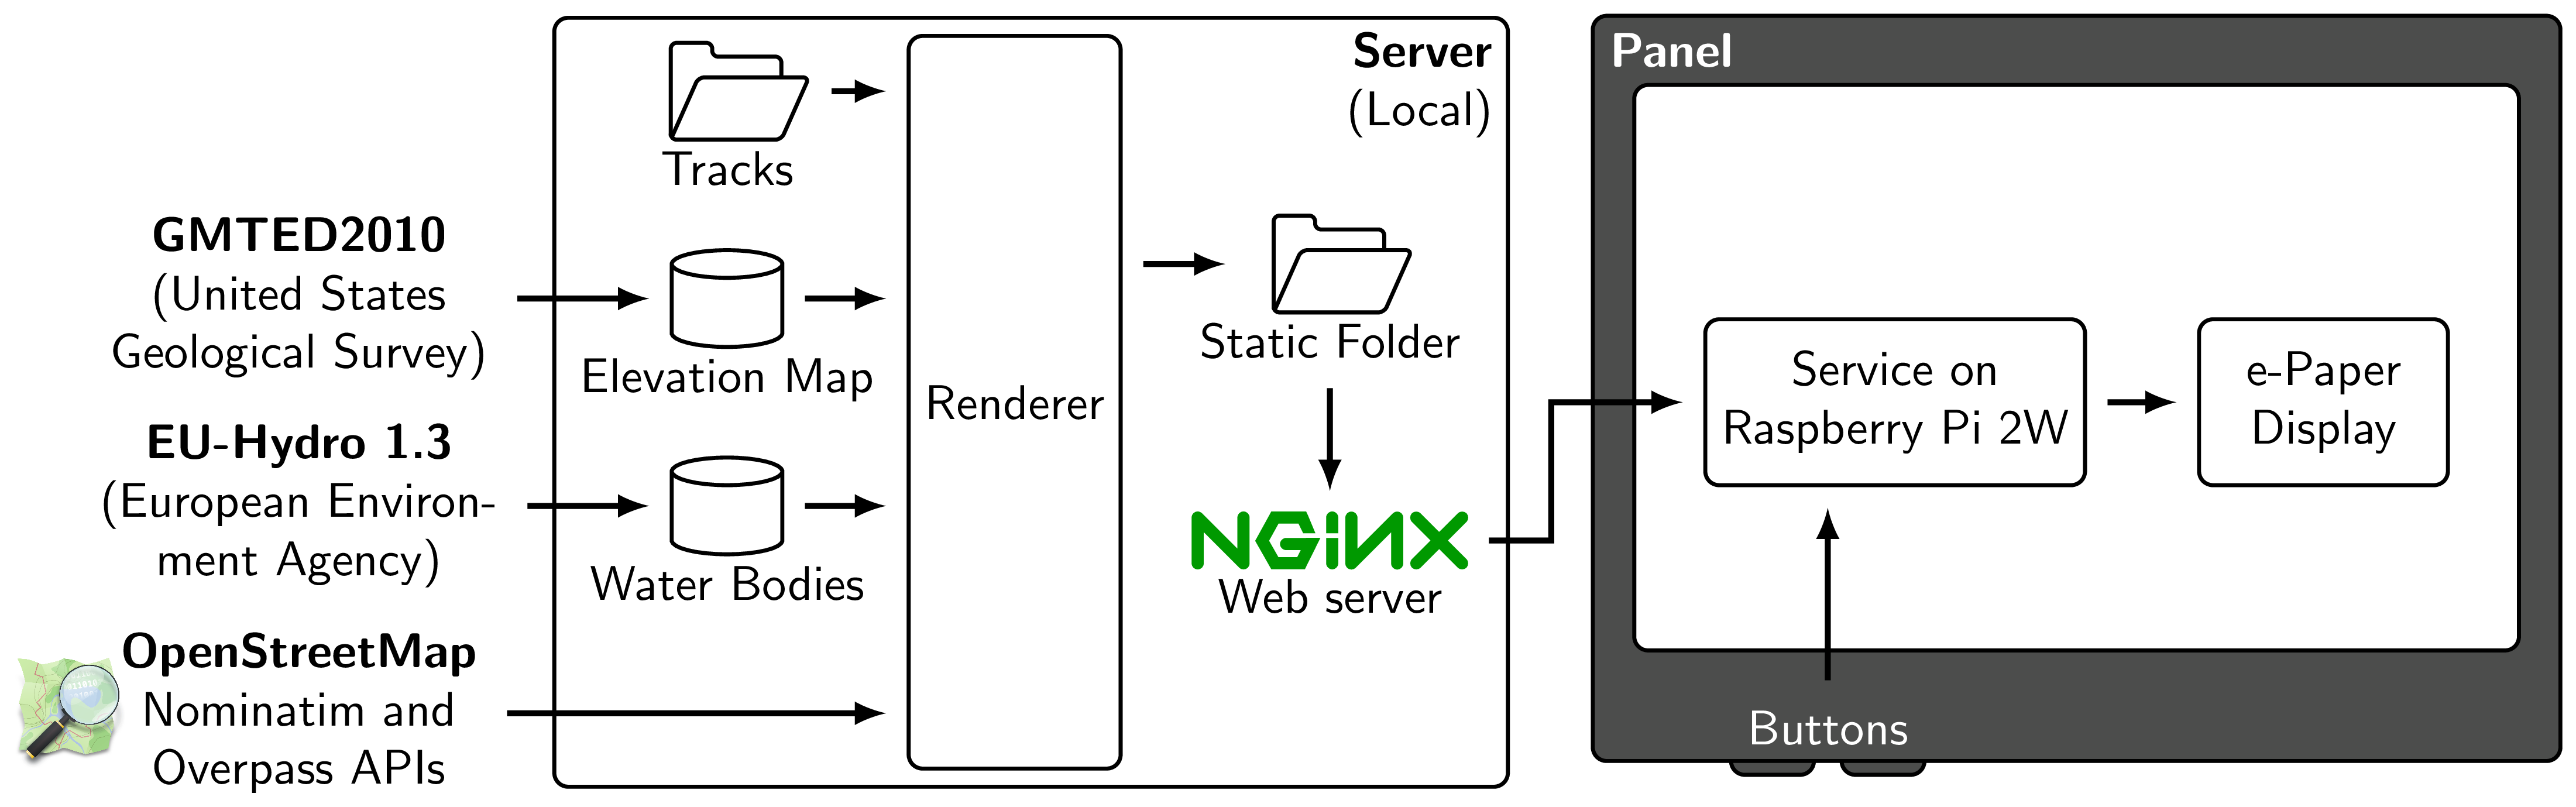
The software comprises two main parts:
- A (local) server that renders and provides the images to be shown. It does the heavy lifting, such as rendering the tracks.
- A service that runs on the Raspberry Pi Zero 2W on the panel and simply loads images from the server to display them.
The software is designed to display several apps, each of which can display several screens. The hiking quiz is an app with three screens that only differ in the placement of the metadata (from Thursday onwards). Other potential apps could be a dashboard or a weather display (the usual suspects for e-Paper displays).
The server runs two components: the renderer periodically renders the app screens to images that are saved on the local file system, where an nginx instance picks them up for static serving. This decoupling of rendering and displaying minimizes the compute on the panel (the compute on the Raspberry Pi Zero 2W is quite limited) and allows for easy development and testing of the rendering code. The most interesting part of this is how the recorded hiking tracks are rendered.
Rendering the tracks is done with a custom Python program (see the bottom of this page for the link to the sources). The tracks are loaded from GPX files and rendered as a line on the screen. The terrain is rendered as contour lines (equal elevation lines), using data from the GMTED2010 dataset, which is kindly provided by the United States Geological Survey (USGS) free of charge. It contains elevation data every 7.5 arc-seconds, which corresponds to around 225m at the equator and less at higher latitudes. Water bodies, such as rivers, lakes, and coastlines, are rendered as well using a pixel-level checkerboard pattern to make them appear gray. The data for the water bodies is taken from the EU-Hydro River Network Database v1.3 dataset, which is kindly provided by the European Environment Agency (EEA), also free of charge. That limits the applicability of the software to Europe, but it could be extended to other regions by using other datasets. Finally, later in the week, additional metadata is gradually added to the image. This contains information about:
- The year and month of the hike: These are simply taken from the GPX file.
- The country, state, and nearest town/village of the starting point: These are identified from longitude and latitude using the OpenStreetMap Nominatim API.
- Landmarks on the way (peaks, saddles, lakes, etc.): These are identified using the OpenStreetMap Overpass API.
Finally, the panel runs a simple service that:
- Checks every minute whether the image for the currently selected screen and app has changed on the server and updates the screen if that is the case.
- Monitors the buttons and switches the selected app/screen.
- Automatically switches to the next app after one hour.
Frame and Electronics
The main components of the panel are:
- A 7.5” e-Paper display (Waveshare 7.5-inch e-Paper HAT),
- A Raspberry Pi Zero 2W,
- Two buttons to switch between apps and screens, and
- A custom frame that holds the display and the Raspberry Pi.
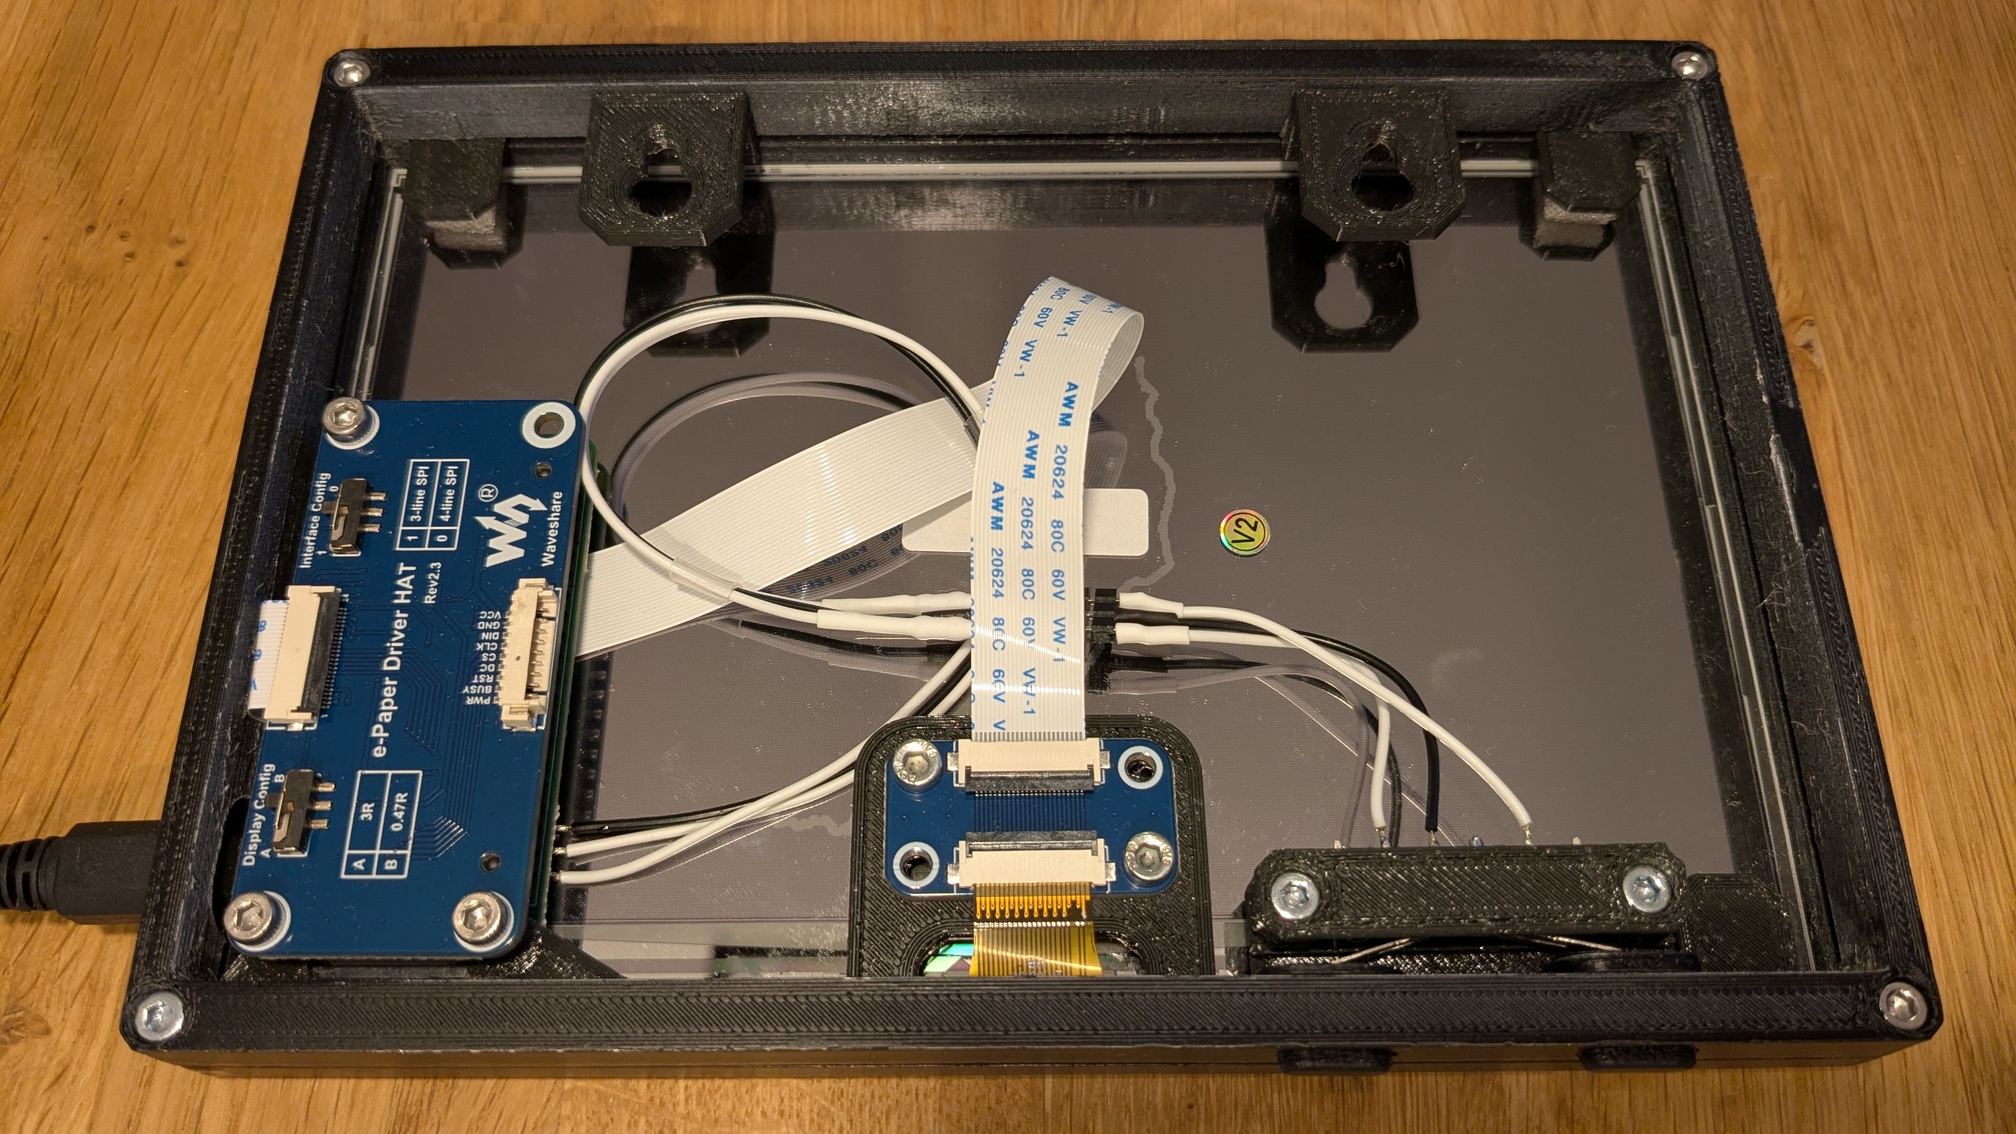
The frame is made from 3D-printed parts and held together with M3 screws and heat-set inserts. The visible edges of the 3D-printed parts are sanded, filled, and painted to give a nice finish. All parts are made available; see the sources below. The e-Paper display is held in place with foam to minimize pressure points. The frame is mounted on the wall with two screws. The two switches connect GPIO20 (left) and GPIO16 (right) to ground when pressed. Notice that these are pins 38 and 36 on the Raspberry Pi Zero 2W, respectively. Finally, everything is powered via a Micro-USB cable that is plugged into the Raspberry Pi. While it may be possible to power it via a rechargeable battery, I opted for a cable for now. I might revisit this in the future.
Final Thoughts
I am quite happy with the result. The display is a nice addition to our living room, and the quiz is a fun way to remember our hikes. It is also a nice conversation starter when guests are around.
Nevertheless, there are a few things that I would do differently in hindsight:
- e-Paper display: The selected display is quite nice, but its pixels are larger than I anticipated. This particularly makes text look quite blocky from up close. I would look for a display with higher resolution, potentially even with grayscale support, which would allow for anti-aliasing.
Sources
You can access the sources at the following links. This includes the software and 3D models.
| Server | https://github.com/ma-rapp/epaper-display-server |
| Panel | https://github.com/ma-rapp/epaper-display-panel |
| (Track Rendering) | https://github.com/ma-rapp/hikingplots * |
*The hikingplots repository is used by the epaper-display-server code.
If you have questions or feedback, please don't hesitate to send me a mail: Your browser does not support Javascript